
ISA Versus Taxable Account in the UK: The Maths Behind a Tax-Free Wrapper Over 10 and 20 Years
An ISA can protect investment growth from UK tax, but the benefit is easiest to see over time. This explainer shows how the wrapper can affect outcomes over 10 and 20 years.

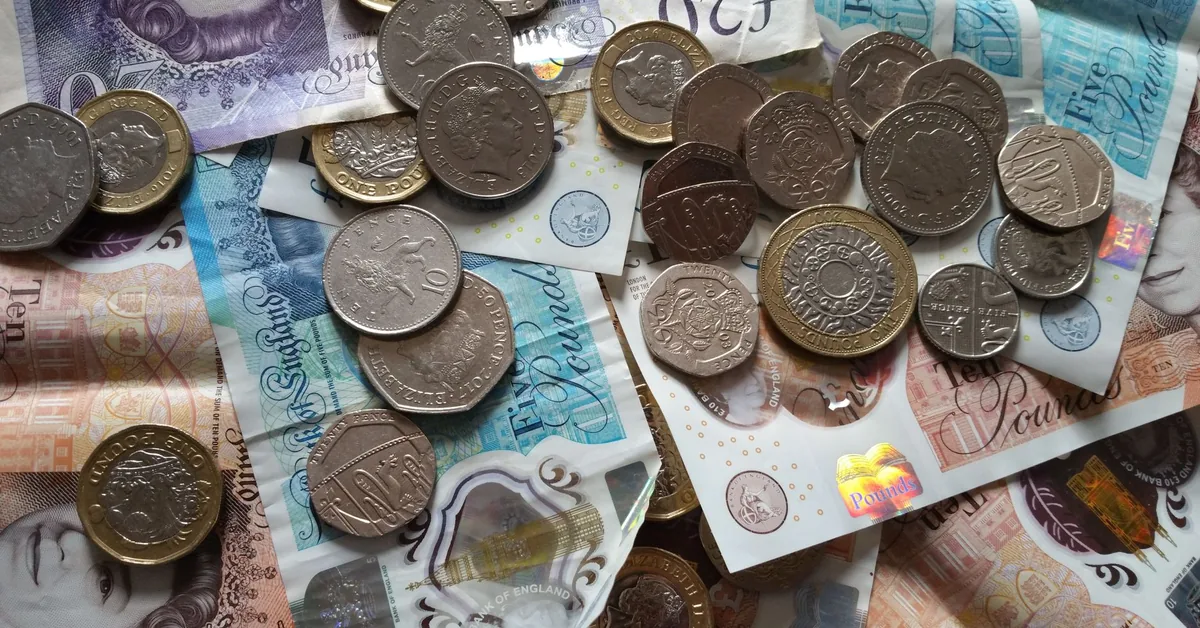
Pexels - Eleonora Vokueva · original
An ISA versus taxable account comparison is really a question about how much of your return stays invested. Over one year, a Stocks and Shares ISA and a taxable general investment account may look similar if they hold the same fund. Over 10 or 20 years, the gap can widen because dividend tax, capital gains tax and the lost future growth on those tax payments can all compound against the taxable account.
The Formula in Plain Language
The calculator starts with the same investment path for both accounts: an opening balance, regular monthly contributions, an assumed annual return and an investment period. The assumed return is not a forecast. It is a way to test how time, compounding, charges and tax interact. If an investment grows by 5 per cent a year in the model, each year’s growth is added to the pot and can itself earn returns in later years.
The ISA wrapper changes the tax treatment. According to HMRC, adults can save up to 20,000 GBP into ISAs in a tax year, and income and gains from ISAs do not count towards taxable income or capital gains under current rules (HMRC, 2026). That does not make the investment safe. A Stocks and Shares ISA can still fall in value, and fund charges and platform fees still reduce returns. The wrapper simply shelters eligible returns from UK tax.
A taxable account needs more assumptions. Dividends may be taxed when they exceed the dividend allowance, and HMRC says dividend tax rates depend on the investor’s Income Tax band (HMRC, 2026). Capital gains tax works differently because it normally applies when an asset is sold or otherwise disposed of. HMRC explains that CGT is charged on the gain, not the full sale proceeds (HMRC, 2026). In real life, the result depends on future tax rules, your income band, dividend yield, realised gains, losses, allowances and when you sell.
The calculator therefore treats tax drag as a reduction in the taxable account’s effective return. That is a simplification, but it is useful. It shows the practical effect of giving up part of the return each year, or at sale, instead of keeping that money invested inside a tax-free wrapper.
A Worked Example
Suppose an investor starts with 10,000 GBP and adds 500 GBP each month into a broad investment fund. They assume a 5 per cent annual return before charges and tax, with income reinvested. This is a simplified illustration, not a recommendation and not a prediction of market returns. As of June 2026, platform fees, fund charges and provider terms should be checked directly before deciding.
After 10 years, the investor would have contributed 70,000 GBP: the 10,000 GBP starting balance plus 60,000 GBP of monthly payments. At 5 per cent annual growth before charges and tax, the pot would be roughly 91,000 GBP. Inside a Stocks and Shares ISA, that growth would be sheltered from UK dividend tax and capital gains tax under current ISA rules.
Now compare a taxable account holding the same investments, but with an estimated annual tax drag of 0.75 percentage points. That reduces the modelled net growth rate from 5 per cent to 4.25 per cent. Over 10 years, the taxable account would grow to roughly 87,000 GBP. The difference, around 4,000 GBP, is not because the ISA picked better investments. It is because more of the return stayed inside the account and kept compounding.
Extend the same assumptions to 20 years and the effect becomes clearer. Total contributions would be 130,000 GBP: the 10,000 GBP starting balance plus 120,000 GBP of monthly payments. At 5 per cent annual growth, the ISA would be worth about 238,000 GBP. At 4.25 per cent after estimated tax drag, the taxable account would be worth about 217,000 GBP. The gap is around 21,000 GBP.
The key point is that tax drag is not only a deduction in the year it happens. Tax paid in year five is money that cannot earn returns in year six, year seven and year 20. That is why the ISA wrapper can look modest over short periods but more meaningful over long ones.
Reading the Result Sensibly
The calculator is most useful when the inputs are realistic. A higher assumed return usually increases the apparent value of the ISA wrapper because there is more growth to shelter. A higher tax rate or dividend yield can also increase the taxable account drag. Smaller balances, short time frames, unused allowances, low dividend income or careful realisation of gains can narrow the difference.
MoneySavingExpert notes that Stocks and Shares ISAs are investment accounts, not savings accounts, so the value can rise or fall and they are usually better suited to longer time frames than cash savings (MoneySavingExpert, 2026). That distinction matters. The ISA wrapper can improve tax efficiency, but it does not remove market risk, platform risk, investment charges or the need for diversification.
The result can also change if your tax position changes. A basic-rate taxpayer, a higher-rate taxpayer and someone using a taxable account below their allowances may all see different outcomes. The same applies if the portfolio produces little dividend income, if gains are realised gradually, or if tax rules change in a future tax year.
This article is general education, not regulated financial advice. Nexzoe is not authorised by the FCA. Tax rules and allowances change each tax year, so check current HMRC guidance or speak to a qualified tax adviser. For personal investment decisions, consider speaking to an FCA-authorised Independent Financial Adviser before choosing between an ISA, a taxable account or any specific provider.
Sources
- Individual Savings Accounts (ISAs) (accessed )
- Capital Gains Tax (accessed )
- Tax on dividends (accessed )
- Stocks and shares ISAs (accessed )
Related articles

ISA Versus Taxable Account in the UK: The Maths Behind a Tax-Free Wrapper Over 10 and 20 Years
Compare an ISA with a taxable account in the UK over 10 and 20 years, including tax, compounding and wrapper benefits.
ISA vs Taxable Account Calculator in the UK: The Maths Over 10 and 20 Years
Compare an ISA with a taxable account in the UK over 10 and 20 years, including tax drag, compounding and allowances.

ISA Early Birds vs. Late Savers in the UK: Which Strategy Maximises Your Returns?
Compare ISA contribution strategies: early tax year deposits vs. spreading payments. Find the best approach for Cash ISAs and Stocks & Shares ISAs in the UK.
